Smart Growth Chamber Monitoring using IoT
Project Objective:
This project is designed to simulate a smart growth chamber using IoT (Internet of Things) technology to monitor and control environmental conditions such as temperature, humidity, light intensity, and CO2 levels. The primary goal of this system is to assist greenhouse owners and eventually farmers in managing the environmental conditions of their greenhouses and growth chambers more effectively. By using this technology, greenhouse owners can monitor and control their environment more precisely, helping them achieve optimal plant growth.
Considering the increasing need for modern technologies among greenhouse owners, this system will soon be enhanced with a mobile app. This app will allow users to monitor the greenhouse remotely and apply necessary actions. With the help of the internet, the data collected from the sensors will be displayed in real-time on mobile devices, enabling greenhouse owners to quickly check the conditions and take necessary steps when required.
Considering the increasing need for modern technologies among greenhouse owners, this system will soon be enhanced with a mobile app.
This app will allow users to monitor the greenhouse remotely and apply necessary actions.
With the help of the internet, the data collected from the sensors will be displayed in real-time on mobile devices, enabling greenhouse owners to quickly check the conditions and take necessary steps when required.
Process
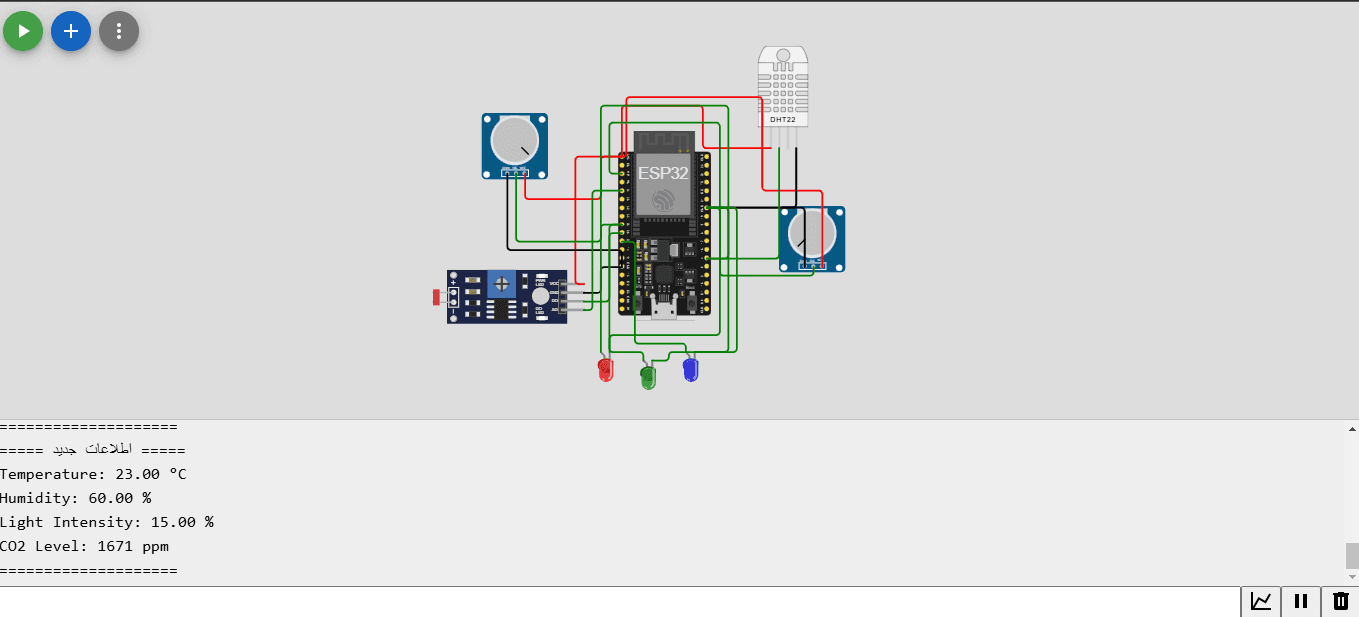
#include <DHT.h>

// Pin definitions for sensors

#define DHTPIN 4        // DHT22 pin (GPIO4)

#define DHTTYPE DHT22   // DHT22 sensor type

#define LED1_PIN 25    // LED1

#define LED2_PIN 26    // LED2

#define LED3_PIN 27    // LED3

DHT dht(DHTPIN, DHTTYPE);  // DHT object

void setup() {

  Serial.begin(115200);     // Start serial monitor

  dht.begin();              // Initialize DHT22 sensor

  // Set LED pins as outputs

  pinMode(LED1_PIN, OUTPUT);

  pinMode(LED2_PIN, OUTPUT);

  pinMode(LED3_PIN, OUTPUT);

}

void loop() {

  // Generate random data for each parameter

  float temperature = random(20, 45); // Temperature range 20-45°C

  float humidity = random(30, 90);    // Humidity range 30%-90%

  float lightIntensity = random(0, 100); // Light intensity range 0%-100%

  int co2Level = random(300, 2000);   // CO2 level range 300-2000 ppm

  // Display data on serial monitor

  Serial.println("===== New Data =====");

  Serial.print("Temperature: "); Serial.print(temperature); Serial.println(" °C");

  Serial.print("Humidity: "); Serial.print(humidity); Serial.println(" %");

  Serial.print("Light Intensity: "); Serial.print(lightIntensity); Serial.println(" %");

  Serial.print("CO2 Level: "); Serial.print(co2Level); Serial.println(" ppm");

  Serial.println("====================");

  // Control LEDs based on light intensity

  if (lightIntensity < 30) {

    digitalWrite(LED1_PIN, HIGH); // Low light → LED1 ON

    digitalWrite(LED2_PIN, LOW);

    digitalWrite(LED3_PIN, LOW);

  } else if (lightIntensity >= 30 && lightIntensity < 70) {

    digitalWrite(LED1_PIN, LOW);

    digitalWrite(LED2_PIN, HIGH); // Medium light → LED2 ON

    digitalWrite(LED3_PIN, LOW);

  } else {

    digitalWrite(LED1_PIN, LOW);

    digitalWrite(LED2_PIN, LOW);

    digitalWrite(LED3_PIN, HIGH); // High light → LED3 ON

  }

  // 1-minute delay (60000 milliseconds)

  delay(60000);

}
2. Components and Parts Used
Microcontroller:
ESP32 is used as the main microcontroller to process data, manage sensor inputs, and control outputs.
Sensors:
DHT22 Temperature and Humidity Sensor:
This sensor is used to measure the temperature and humidity in the greenhouse. The data is sent to the microcontroller for monitoring environmental conditions.
Temperature: Range of 20-45°C
Humidity: Range of 30%-90%
Light Intensity Sensor (Random Light Intensity):
This project uses random data to simulate light intensity. In the real project, sensors like LDR (Light Dependent Resistor) will be used to measure light intensity.
Light Intensity: 0%-100%
CO2 Level Sensor (Random CO2 Level):
Random data is used to simulate CO2 levels in this project. In the future, real CO2 sensors will be used to measure CO2 levels in the environment.
CO2 Level: 300-2000 ppm
LEDs:
Three LEDs are used to display the light intensity status and control the growth chamber’s condition:
LED1: Low light
LED2: Medium light
LED3: High light
3. How Components Are Connected
Physical Connections:
ESP32/Arduino: The microcontroller is responsible for processing data and managing input/output operations.
DHT22 Temperature and Humidity Sensor: Connected to digital pin 4 of the microcontroller.
LEDs: Three LEDs are connected to digital pins 25, 26, and 27 of the microcontroller, and they light up based on light intensity.
4. Code for Simulation
The following code reads simulated data from the sensors and controls the LEDs based on light intensity. The random data serves as an initial step, with actual sensor data replacing it in the future.
———————————————————————————
———————————————————————————-
Code Functionality:
Data Reading: The random data for temperature, humidity, light intensity, and CO2 level is generated.
Data Display: The generated data is displayed on the serial monitor.
LED Control: Based on light intensity, one of the LEDs will light up:
If light intensity is less than 30%, LED1 will light up.
If light intensity is between 30% and 70%, LED2 will light up.
If light intensity is more than 70%, LED3 will light up.
5. Sample Data and Simulation
Sample Output:
Here’s an example of how the data will appear in the serial monitor:
————————————————————————————————--
===== New Data =====
Temperature: 34.00 °C
Humidity: 65.00 %
Light Intensity: 50 %
CO2 Level: 850 ppm
====================
————————————————————————————————--
Based on this data, LED2 will light up since the light intensity is medium.
2. Components and Parts Used
Microcontroller:
ESP32 is used as the main microcontroller to process data, manage sensor inputs, and control outputs.
Sensors:
DHT22 Temperature and Humidity Sensor:
This sensor is used to measure the temperature and humidity in the greenhouse. The data is sent to the microcontroller for monitoring environmental conditions.
Temperature: Range of 20-45°C
Humidity: Range of 30%-90%
Light Intensity Sensor (Random Light Intensity):
This project uses random data to simulate light intensity. In the real project, sensors like LDR (Light Dependent Resistor) will be used to measure light intensity.
Light Intensity: 0%-100%
CO2 Level Sensor (Random CO2 Level):
Random data is used to simulate CO2 levels in this project. In the future, real CO2 sensors will be used to measure CO2 levels in the environment.
CO2 Level: 300-2000 ppm
LEDs:
Three LEDs are used to display the light intensity status and control the growth chamber’s condition:
LED1: Low light
LED2: Medium light
LED3: High light
3. How Components Are Connected
Physical Connections:
ESP32/Arduino: The microcontroller is responsible for processing data and managing input/output operations.
DHT22 Temperature and Humidity Sensor: Connected to digital pin 4 of the microcontroller.
LEDs: Three LEDs are connected to digital pins 25, 26, and 27 of the microcontroller, and they light up based on light intensity.
4. Code for Simulation
The following code reads simulated data from the sensors and controls the LEDs based on light intensity. The random data serves as an initial step, with actual sensor data replacing it in the future.
————————————————————————————————--
————————————————————————————————--
Code Functionality:
Data Reading: The random data for temperature, humidity, light intensity, and CO2 level is generated.
Data Display: The generated data is displayed on the serial monitor.
LED Control: Based on light intensity, one of the LEDs will light up:
If light intensity is less than 30%, LED1 will light up.
If light intensity is between 30% and 70%, LED2 will light up.
If light intensity is more than 70%, LED3 will light up.
5. Sample Data and Simulation
Sample Output:
Here’s an example of how the data will appear in the serial monitor:
————————————————————————————————--
===== New Data =====
Temperature: 34.00 °C
Humidity: 65.00 %
Light Intensity: 50 %
CO2 Level: 850 ppm
====================
————————————————————————————————--
Based on this data, LED2 will light up since the light intensity is medium.
Conclusion
This project serves as an initial simulation of a smart growth chamber that utilizes IoT for monitoring and controlling environmental conditions in greenhouses. This system helps greenhouse owners and farmers monitor the environmental conditions in their space and make better decisions for plant growth.
In the future, this system will be completed with a mobile app that will allow users to monitor the greenhouse remotely. The app will display real-time data collected from sensors, making it easier for greenhouse owners to check the conditions and take actions when necessary, no matter where they are.