Soil Data Analysis with Python

Project Introduction:

"Hello there! Welcome to the soil data analysis project page. This project was designed to use various soil data for analysis to improve agriculture and better manage soil resources. The main goal is to predict soil characteristics like pH, humidity, nitrogen (N), phosphorus (P), and potassium (K) levels using machine learning models. If you're like me and passionate about agriculture and the environment, this project is a great way to get started with data analysis!"

How It Works

"First of all, the data collected from various soil samples includes information such as geographic coordinates, soil type, pH, humidity, and levels of nitrogen, phosphorus, and potassium. We analyzed this data using Python and libraries like Pandas and Scikit-learn. Initially, we preprocessed the data to ensure that we had clean and suitable information for modeling.

Next, we used regression models to predict various soil characteristics. The results were fascinating! We can now predict soil conditions based on the collected data."

Models and Algorithms Used

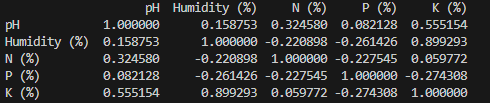
"For this project, we used linear regression algorithms to understand the relationships between different soil properties. We divided the data into training and testing sets to train our models and then evaluated their performance. After training, we compared the model predictions with the actual values to assess the error rates. The results showed that the model is quite accurate in predicting soil characteristics."

How You Can Use This Project

"You can easily run this project on your own system! Simply input your soil data in the required format, and with the provided code from GitHub, you can generate predictions about your soil conditions. If you have any questions or need assistance, feel free to reach out to me. I'm here to help!"

#بارگذاری کتابخونه های مورد نیاز
import pandas as pd
import matplotlib.pyplot as plt
from sklearn.model_selection import train_test_split
from sklearn.linear_model import LinearRegression
from sklearn.metrics import mean_squared_error, r2_score

#بارگذاری داده ها
data = pd.read_excel('soil_data.xlsx', engine='openpyxl')

 #نمایش 5 ردیف اول داده ها
print(data.head())

#بررسی اطلاعات کلی داده ها
print(data.info())

#بررسی آماری داده ها
print(data.describe())

#بررسی داده های گمشده
print(data.isnull().sum())

#تبدیل ستون soil type به نوع داده ی categorial
data['Soil Type'] = data['Soil Type'].astype('category')


#رسم نمودار برای pH و Humidity
plt.scatter(data['pH'], data['Humidity (%)'])
plt.xlabel('pH')
plt.ylabel('Humidity (%)')
plt.grid(True)
plt.show()

#محاسبه همبستگی  بین ویژگی های عددی خاک 
correlation_matrix = data[['pH', 'Humidity (%)', 'N (%)', 'P (%)', 'K (%)']].corr()

# نمایش ماتریس همبستگی
print(correlation_matrix)


#مدلسازی
#گام اول : انتخاب ویژگی ها و هدف
X = data[['Humidity (%)', 'N (%)', 'P (%)', 'K (%)']]  # ویژگی‌های ورودی
y = data['pH']  # ویژگی هدف

#گام دوم : تقسیم داده ها به دودسته ی اموزش و تست
X_train, X_test, y_train, y_test = train_test_split(X, y, test_size=0.1, random_state=42)

#گام سوم: ساخت مدل پیش بینی که در اینجا مدل رگرسیون خطی عه
model = LinearRegression()

#گام چهارم: آموزش مدل
model.fit(X_train, y_train)

#گام پنجم : پیش بینی با داده های تست
y_pred = model.predict(X_test)

#گام ششم : نمایش نتیجه ها
print(f'مقادیر پیش بینی: {y_pred}')
print(f'مقادیر واقعی: {y_test.values}')


#ارزیابی مدل با استفاده از MSE - R2#
#گام اول ارزیابی : محاسبه MSE و 
mse = mean_squared_error(y_test, y_pred)
r2 = r2_score(y_test, y_pred)

#نمایش نتیجه ارزیابی
print(f'Mean Squared Error: {mse}')
print(f'R²: {r2}')

# ایجاد DataFrame برای ذخیره نتایج
results = pd.DataFrame({
    'Actual': y_test,
    'Predicted': y_pred,
    'Error': y_test - y_pred
})
# ذخیره در فایل CSV
results.to_csv('prediction_results.csv', index=False)

print("نتایج در فایل 'prediction_results.csv' ذخیره شدند.")

#بصری سازی مقادیر پیش بینی شده
plt.figure(figsize=(10, 6))
plt.plot(y_test.values, label='Actual', marker='o')
plt.plot(y_pred, label='Predicted', marker='x')
plt.title('Comparison of Actual vs Predicted Values')
plt.xlabel('Sample Index')
plt.ylabel('Values')
plt.legend()
plt.grid(True)
plt.show()

if you don't have GitHub account, here you are!!

Relevant Links and GitHub Repository

"To access the project code, visit the [GitHub Project](GitHub link). Here you can find all the code and datasets related to the project."

Relevant Links and GitHub Repository

"To access the project code, visit the [GitHub Project](GitHub link). Here you can find all the code and datasets related to the project."

Relevant Links and GitHub Repository

"To access the project code, visit the [GitHub Project](GitHub link). Here you can find all the code and datasets related to the project."

Upgrade your Business

with a Smile on your face!

Schedule a call with me ASAP!

Upgrade your Web presence with Framer

Schedule a call with me ASAP!

Upgrade your Business

with a Smile on your face!

Schedule a call with me ASAP!